Observability Gaps: What Your Monitoring Stack Cannot See Is Already Costing You
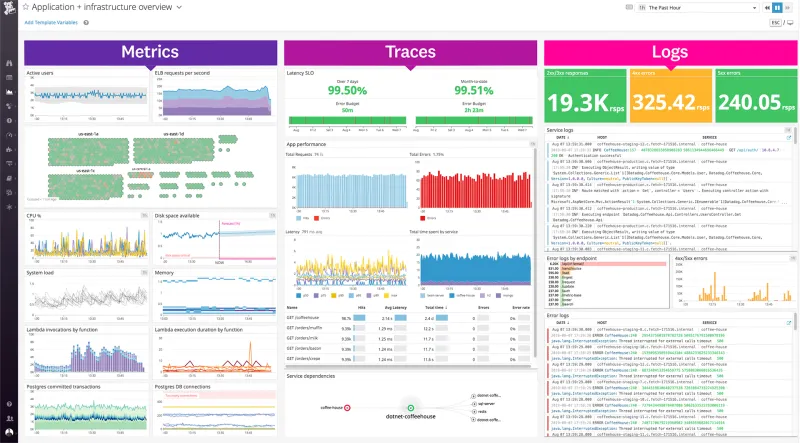
Photo: developer monitoring dashboard observability metrics server performance, via static.linuxblog.io
There is a particular kind of confidence that comes from a dashboard full of green indicators. Response times look acceptable. Error rates sit below threshold. Uptime is holding steady. And yet, somewhere in production, a slow memory leak is expanding, a downstream API is degrading intermittently, and a background job is silently dropping records. Your monitoring stack sees none of it.
This is not a failure of intention. Most engineering teams invest meaningfully in observability tooling. The problem is structural: monitoring configurations are typically built reactively, instrument only the surfaces that were already known to be fragile, and accumulate technical debt the same way application code does. The result is a production environment that looks observable but is, in practice, riddled with blind spots.
Understanding why those gaps exist — and how to close them systematically — is one of the highest-leverage investments a development team can make.
How Observability Debt Accumulates
The mechanics of observability debt closely mirror those of architectural debt. Early in a project's lifecycle, teams instrument the obvious touchpoints: HTTP endpoints, database query times, and perhaps a handful of custom business metrics. Those instruments work well enough during the initial launch phase, when the application surface area is small and the team has full context on every component.
As the system grows, however, new services are added, third-party integrations multiply, and background processing layers expand. Each addition carries implicit assumptions about what is already being monitored. Engineers shipping new features rarely audit the existing telemetry configuration. The monitoring setup that made sense for a three-service application quietly becomes inadequate for a twenty-service one — but the dashboards still look green, so the gap goes unnoticed.
The compounding factor is the tooling itself. Many popular monitoring platforms prioritize ease of initial setup over depth of coverage. They provide sensible defaults that capture surface-level metrics efficiently, but those defaults become a ceiling rather than a floor when teams stop customizing.
Vanity Metrics Versus Signals That Actually Matter
Before auditing what your stack is missing, it is worth examining what it is currently measuring — because a significant portion of most monitoring configurations is devoted to metrics that feel informative but rarely drive decisions.
Aggregate uptime percentages, for instance, are among the most commonly displayed and least actionable metrics in production dashboards. A service can maintain 99.9 percent uptime while delivering a degraded experience to a specific cohort of users in a particular geographic region or on a specific client version. The aggregate masks the segment.
Similarly, mean response time is a notoriously misleading indicator. A service with a mean latency of 120 milliseconds may be delivering 4,000-millisecond responses to the 99th-percentile user — the user who is most likely to churn or escalate a support ticket. Percentile-based latency metrics (p95, p99) tell a fundamentally different story than means, and teams that rely on means are operating with an incomplete picture.
The discipline of separating signal from noise requires a deliberate audit of every metric currently in your stack. For each one, ask two questions: Does this metric change my team's behavior when it moves? And does this metric correlate with user-facing outcomes? If the answer to both is no, the metric is consuming dashboard real estate without contributing to operational awareness.
Conducting a Monitoring Infrastructure Audit
A structured audit of your monitoring stack does not require a dedicated sprint or a platform migration. It can begin with a straightforward gap analysis across four domains.
Coverage mapping involves documenting every service, integration, and background process in your production environment and verifying that each has active instrumentation. This exercise frequently surfaces entire service categories — queue processors, scheduled tasks, webhook handlers — that are running in production with no telemetry attached.
Instrumentation depth examines whether existing monitors are capturing the right granularity. Services that are instrumented only at the HTTP layer may be hiding slow database queries, inefficient cache patterns, or expensive serialization operations that are invisible at the surface level.
Alerting fidelity reviews the alert configurations attached to existing metrics. Alerts set on thresholds that are never breached in practice are not safety nets — they are noise generators that train teams to ignore notifications. Conversely, services operating without alert coverage represent genuine operational risk.
Correlation capability assesses whether your monitoring tools can connect events across services. Distributed tracing is the clearest example of this capability. Without it, a latency spike in a user-facing service may be entirely disconnected from the downstream database contention or third-party API timeout that caused it.
Selecting Telemetry Tooling That Fits Development Workflows
One of the most persistent observability problems in engineering organizations is the adoption of monitoring tools that create more work than they eliminate. Platforms that require extensive manual instrumentation, complex configuration management, or context-switching away from the development environment tend to be under-utilized — not because engineers are negligent, but because friction compounds over time.
The most effective telemetry tools share several characteristics. They integrate at the framework or runtime level, capturing baseline telemetry without requiring per-endpoint configuration. They expose data in formats that align with the team's existing workflows, whether that means native integrations with CI/CD pipelines, IDE extensions that surface performance regressions during development, or Slack-native alerting that meets engineers where they already communicate.
OpenTelemetry has emerged as the most credible standard for vendor-neutral instrumentation, and its adoption is now broad enough that most major monitoring platforms support it natively. Building instrumentation on OpenTelemetry primitives rather than proprietary SDKs gives teams the flexibility to evolve their monitoring stack without re-instrumenting their codebase.
For teams operating in containerized environments, sidecar-based telemetry collection — where an agent runs alongside application containers and captures infrastructure-level metrics automatically — can close coverage gaps without requiring changes to application code.
Closing the Loop: From Audit to Action
An observability audit is only as valuable as the remediation work it drives. The most practical approach is to prioritize instrumentation additions based on user impact rather than technical completeness. Services that sit in the critical path of revenue-generating or user-retention workflows deserve first attention. Background processes and internal tooling can follow.
Equally important is establishing a process that prevents new observability gaps from shipping. Instrumentation requirements belong in definition-of-done checklists, not post-incident retrospectives. When a new service or integration ships without telemetry, the gap should be treated with the same urgency as a missing unit test suite.
The teams that operate most effectively in production are not those with the most elaborate monitoring dashboards. They are the ones who have matched their instrumentation precisely to the questions that matter — and built the discipline to keep that alignment intact as their systems evolve.
Your monitoring stack is not failing because the tools are inadequate. It is failing because the configuration has not kept pace with the system it is supposed to observe. That is a solvable problem, and it starts with acknowledging what you cannot currently see.