Extension Overload: How Your IDE Plugin Library Is Quietly Undermining Your Development Velocity
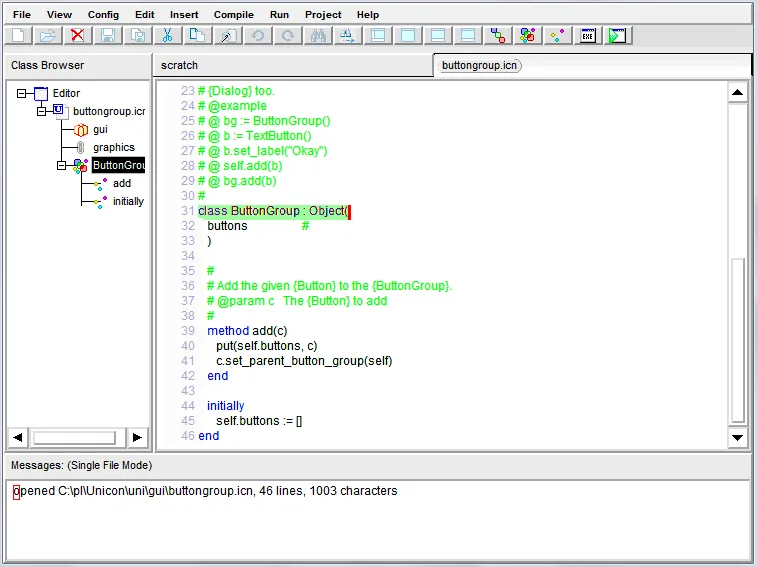
Photo: unicon.sf.net developers, GPL, via Wikimedia Commons
There is a peculiar ritual that most developers recognize. You set up a new machine, open your IDE, and spend the better part of an afternoon restoring your familiar constellation of extensions. Prettier. GitLens. ESLint. A theme pack. A bracket colorizer. A Pomodoro timer. A snippet library. Before long, your editor has transformed from a focused development environment into something closer to a fully loaded SaaS dashboard — and it behaves like one, too.
The irony is that the tools intended to make you faster are often the primary reason your environment feels sluggish. This is not a theoretical concern. It is a measurable, diagnosable, and entirely solvable performance problem that affects teams across the country — and it compounds in proportion to how long a developer has been customizing their setup.
The Accumulation Problem
IDEs like Visual Studio Code, JetBrains IntelliJ, and similar platforms are architected to be extensible. That extensibility is a genuine strength, but it creates an environment where accumulation is frictionless and removal feels risky. Installing an extension takes seconds. Evaluating whether that extension is still necessary six months later almost never happens.
The result is what might be called extension debt — a silent accumulation of background processes, event listeners, language servers, and UI contributions that each impose a modest cost individually but collectively degrade the environment in ways that are difficult to attribute. Developers rarely connect a sluggish autocomplete response or a three-second startup delay to the twelve extensions they installed during a particularly enthusiastic weekend of environment customization.
A lean VS Code installation with five or six well-chosen extensions will typically start in under two seconds on modern hardware. A heavily loaded installation — not an unusual one, just one that reflects a year or two of casual plugin adoption — can take eight to twelve seconds before the editor is fully responsive. On a day when you are context-switching between a local environment, a remote container, and a browser-based debugging session, that overhead adds up in ways that are genuinely frustrating.
Running a Real Diagnostic
Before you can make intelligent decisions about your extension portfolio, you need actual data. Fortunately, most modern IDEs expose performance tooling that developers rarely use.
In VS Code, the built-in command Developer: Show Running Extensions provides a real-time view of which extensions are active and how long each took to activate. The --prof-startup flag, passed via the command line, generates a detailed startup profile that can be loaded in the browser's performance panel for granular analysis. Extensions that register themselves as activation events on workspace open — rather than on-demand — are the primary contributors to startup latency.
JetBrains products offer a similar diagnostic pathway through the Help > Diagnostic Tools > Analyze Plugin Graph workflow, which visualizes inter-plugin dependencies and highlights which plugins are blocking the indexing pipeline.
The goal of this audit is not to produce a list of extensions to delete immediately. It is to make the invisible visible — to replace vague frustration with concrete data that supports a deliberate decision.
A Framework for Ruthless Evaluation
Once you have your diagnostic data, the evaluation framework should be built around a single governing question: Does this extension reduce the time between writing code and shipping it?
That question is deliberately narrow. It excludes extensions that make the editor look nicer, provide information that is interesting but not actionable, or replicate functionality that already exists natively. It also excludes extensions that you installed for a specific project three years ago and have not needed since.
Apply this filter across three categories:
Automation extensions — Tools that lint, format, or transform code without requiring manual invocation. These have a clear, measurable impact on shipping velocity and are worth their overhead if they are configured correctly and actually running on save.
Navigation and comprehension extensions — Tools like GitLens, symbol search enhancers, or documentation popups. These are valuable in proportion to the complexity of the codebase. On a small project, they are often redundant with native functionality. On a large monorepo, they can be genuinely indispensable.
Comfort and aesthetic extensions — Themes, icon packs, bracket highlighters. These impose real overhead for benefits that do not translate to shipping speed. They are not necessarily wrong to have, but they should be the first category audited when performance becomes a concern.
Lean Profiles and Workspace-Scoped Configuration
One of the most underutilized features in modern IDEs is the ability to scope extension activation to specific workspaces or projects. VS Code's .vscode/extensions.json file allows teams to specify a recommended extension set for a given repository — and equally important, it supports disabling globally installed extensions at the workspace level.
This pattern enables a more sophisticated approach than the binary install-or-remove decision. A developer working across a React frontend, a Go microservice, and a Python data pipeline does not need all three language ecosystems active simultaneously. Workspace profiles allow the IDE to load only what is relevant to the current context, dramatically reducing memory pressure and activation overhead.
Several engineering teams at mid-sized US software companies have reported reducing their average IDE memory footprint by thirty to forty percent simply by auditing their workspace profiles and disabling globally activated extensions that had no relevance to the project at hand.
The Productivity Paradox of Feeling Busy
There is a psychological dimension to this problem that deserves acknowledgment. Extensions that surface information — code coverage badges, inline blame annotations, complexity scores — create an impression of productivity without necessarily enabling it. A developer who can see that a function has a cyclomatic complexity of fourteen is not automatically going to refactor it. But the extension that provides that information is running continuously, consuming memory, and contributing to a cognitive environment that can feel busy without being productive.
The discipline required here is the same discipline required in any performance engineering context: measure first, optimize deliberately, and resist the temptation to treat activity as a proxy for output.
Your IDE is a tool. Like any tool in a professional's kit, it should be maintained, audited, and occasionally stripped back to what is actually necessary. The developers who ship consistently are often not the ones with the most sophisticated environments — they are the ones who have learned to work with precision rather than abundance.